Erronious perfidious influenza information
Erronious perfidious influenza information
Aren’t you glad the Corporation for Public Broadcasting is shutting its doors, and PBS is downsizing?

The fake horrible flu season.
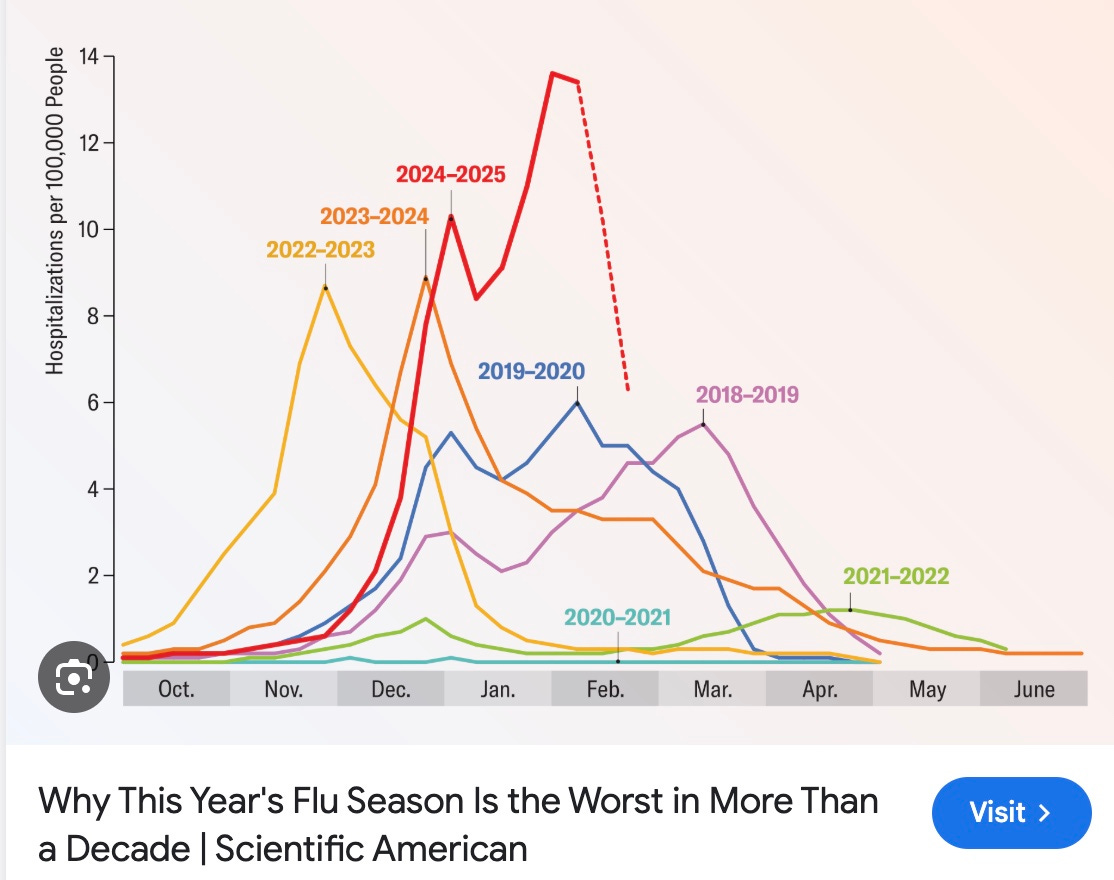
First, the worst flu season in 20 years was in 2017-18, (though the 2009-10 swine flu season lasted all year, so I am leaving that one out) when there were 3 times as many deaths recorded as caused primarily by flu on death certificates (about 6,500) as in a usual year (when there are usually a bit over 2,000 deaths directly attributed to flu as the main cause of death). This is considered highly reliable data. After that year, 2024-25 was said to be the worst year.
When they tell you this year looks like the worst flu season in 20 years (or more) that is simply an outright lie.
Check out how last year, Scientific American claimed that last year’s flu (2024-25) was the worst in more than a decade. In order to make the claim, they omitted the worse 2017-18 season, and only compared last year’s hospitalization rate to the prior 6 years. Is there any science left in Scientific American?
It is not unusual for flu seasons to start early, with the month of peak of flu activity each year since 1982 graphed by CDC. So this was not such a crazy early flu season, as also had been claimed.
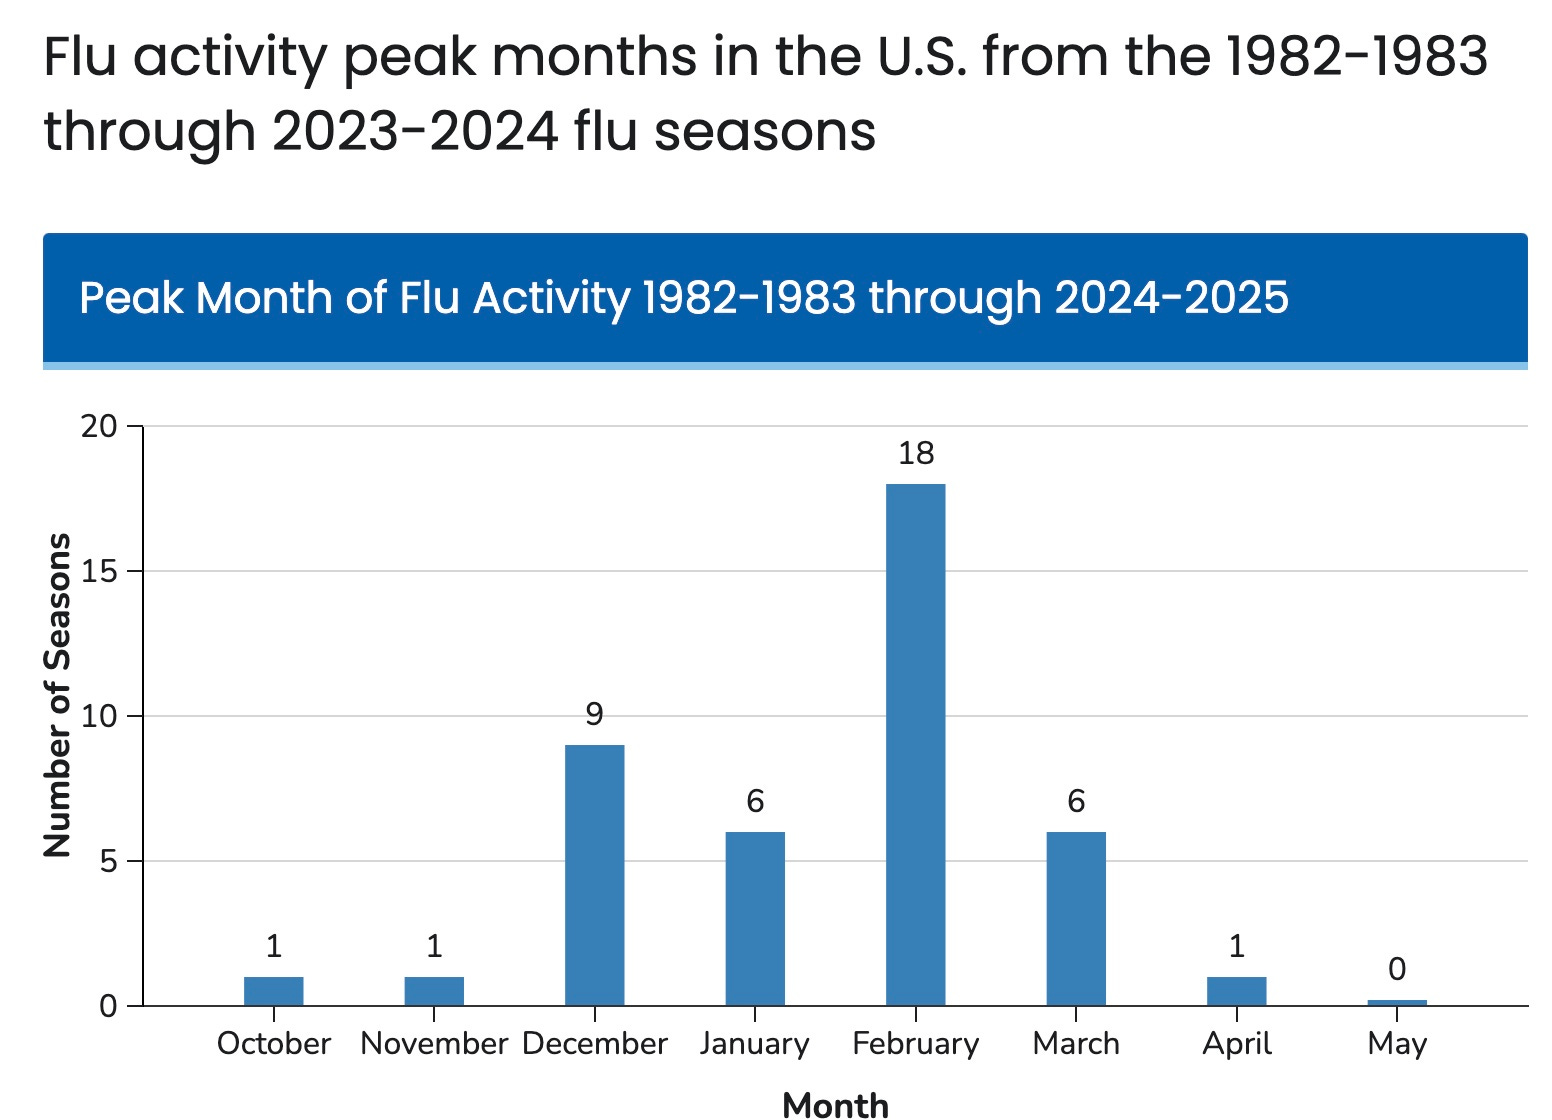
CDC seems to use the same trick as Scientific American. It too omits that problematic 2017-18 year, even though at the bottom of its diagram the year is listed with a mauve color, as if it was included at one point. Funny how that happens.
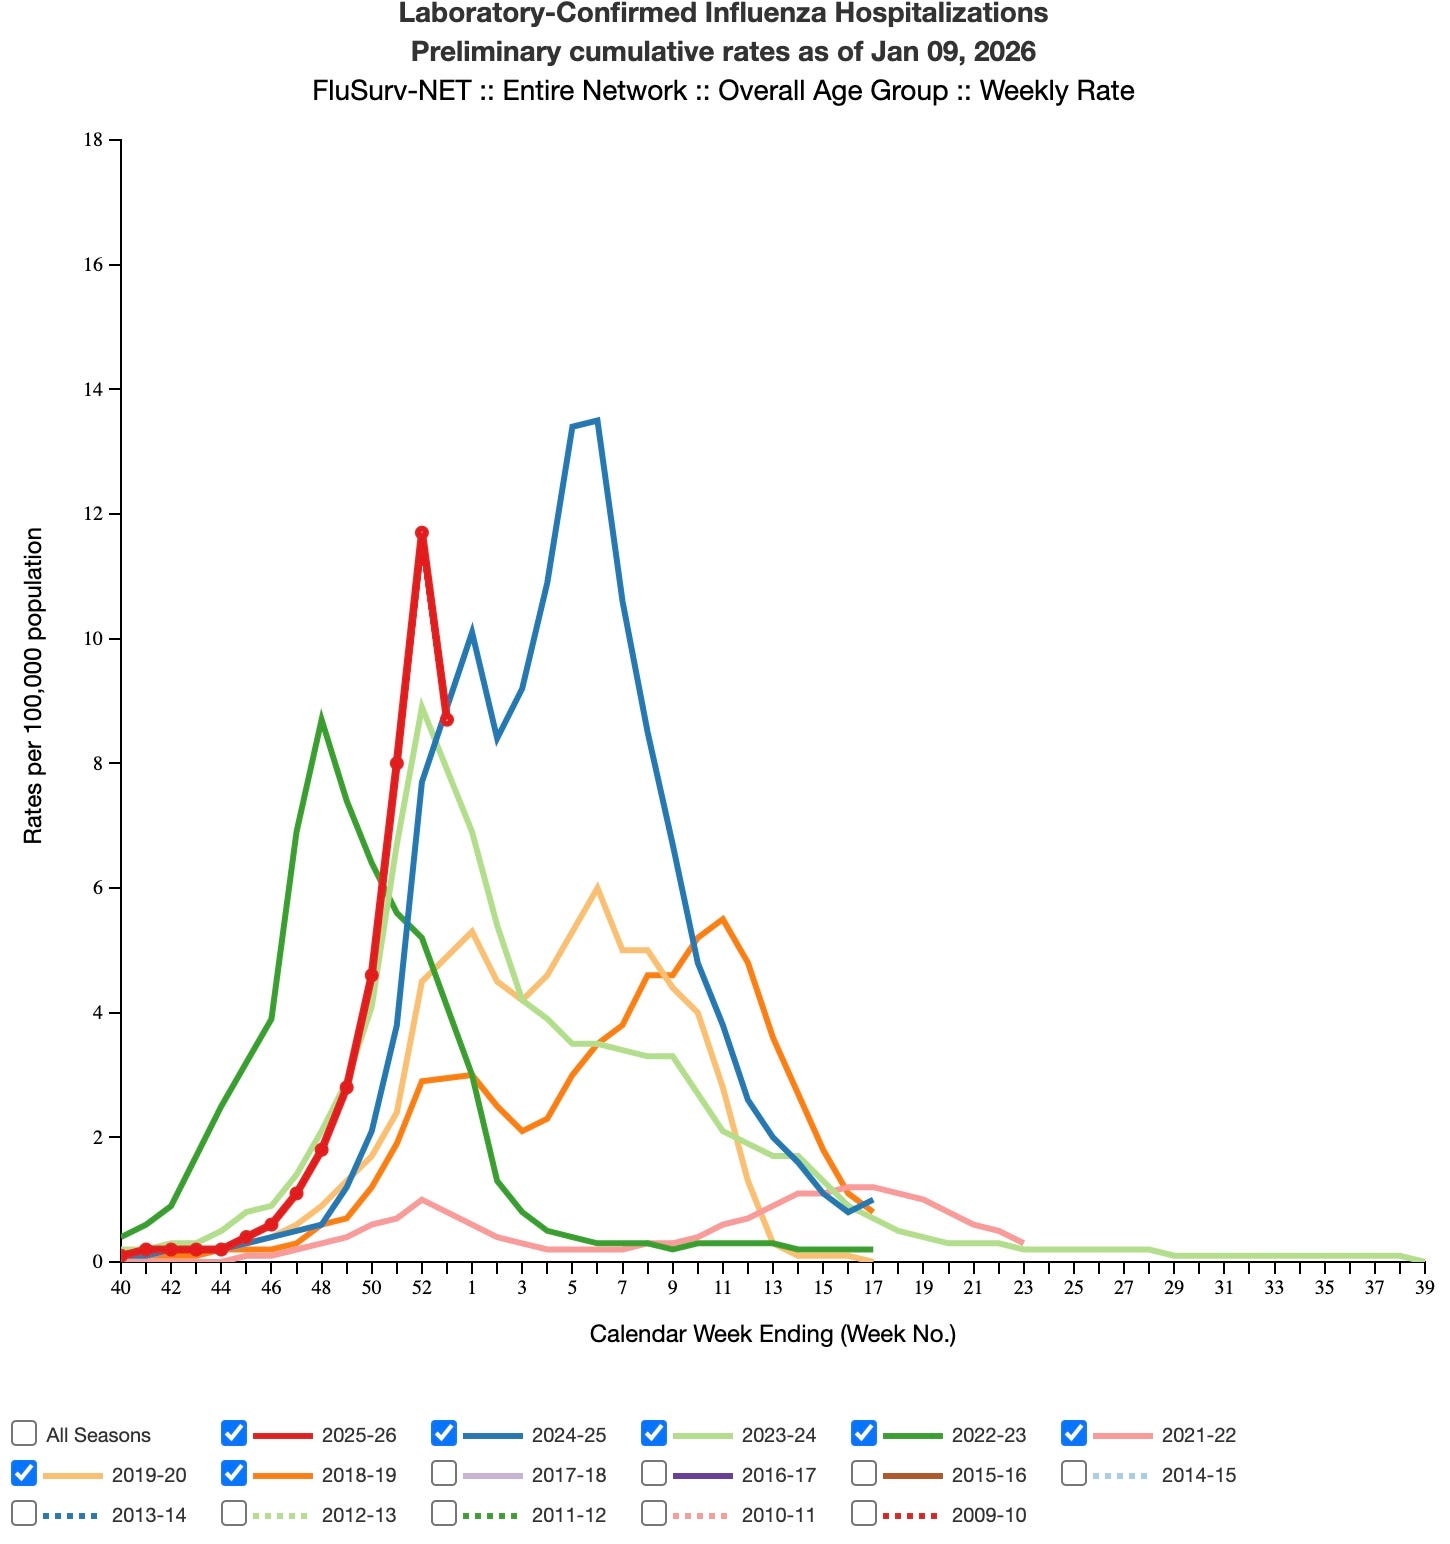
Here’s the good news! This season’s flu, in red, has peaked and and flu hospitalizations are falling fast! I spent 6 hrs in the NYU ER Thursday night (not the NYC ER where the police killed a patient welding a knife yesterday) and it was filled with about 3 times as many patients as it had been built for. I did not hear anyone, not one person, coughing. Nor in the waiting room was there any coughing. So, while sometimes there is a double peak, in NYC I am convinced the peak has come and gone. BTW, CDC’s current graph is always one week behind and updates on Fridays.
Yet this is from today’s Associated Press and PBS:
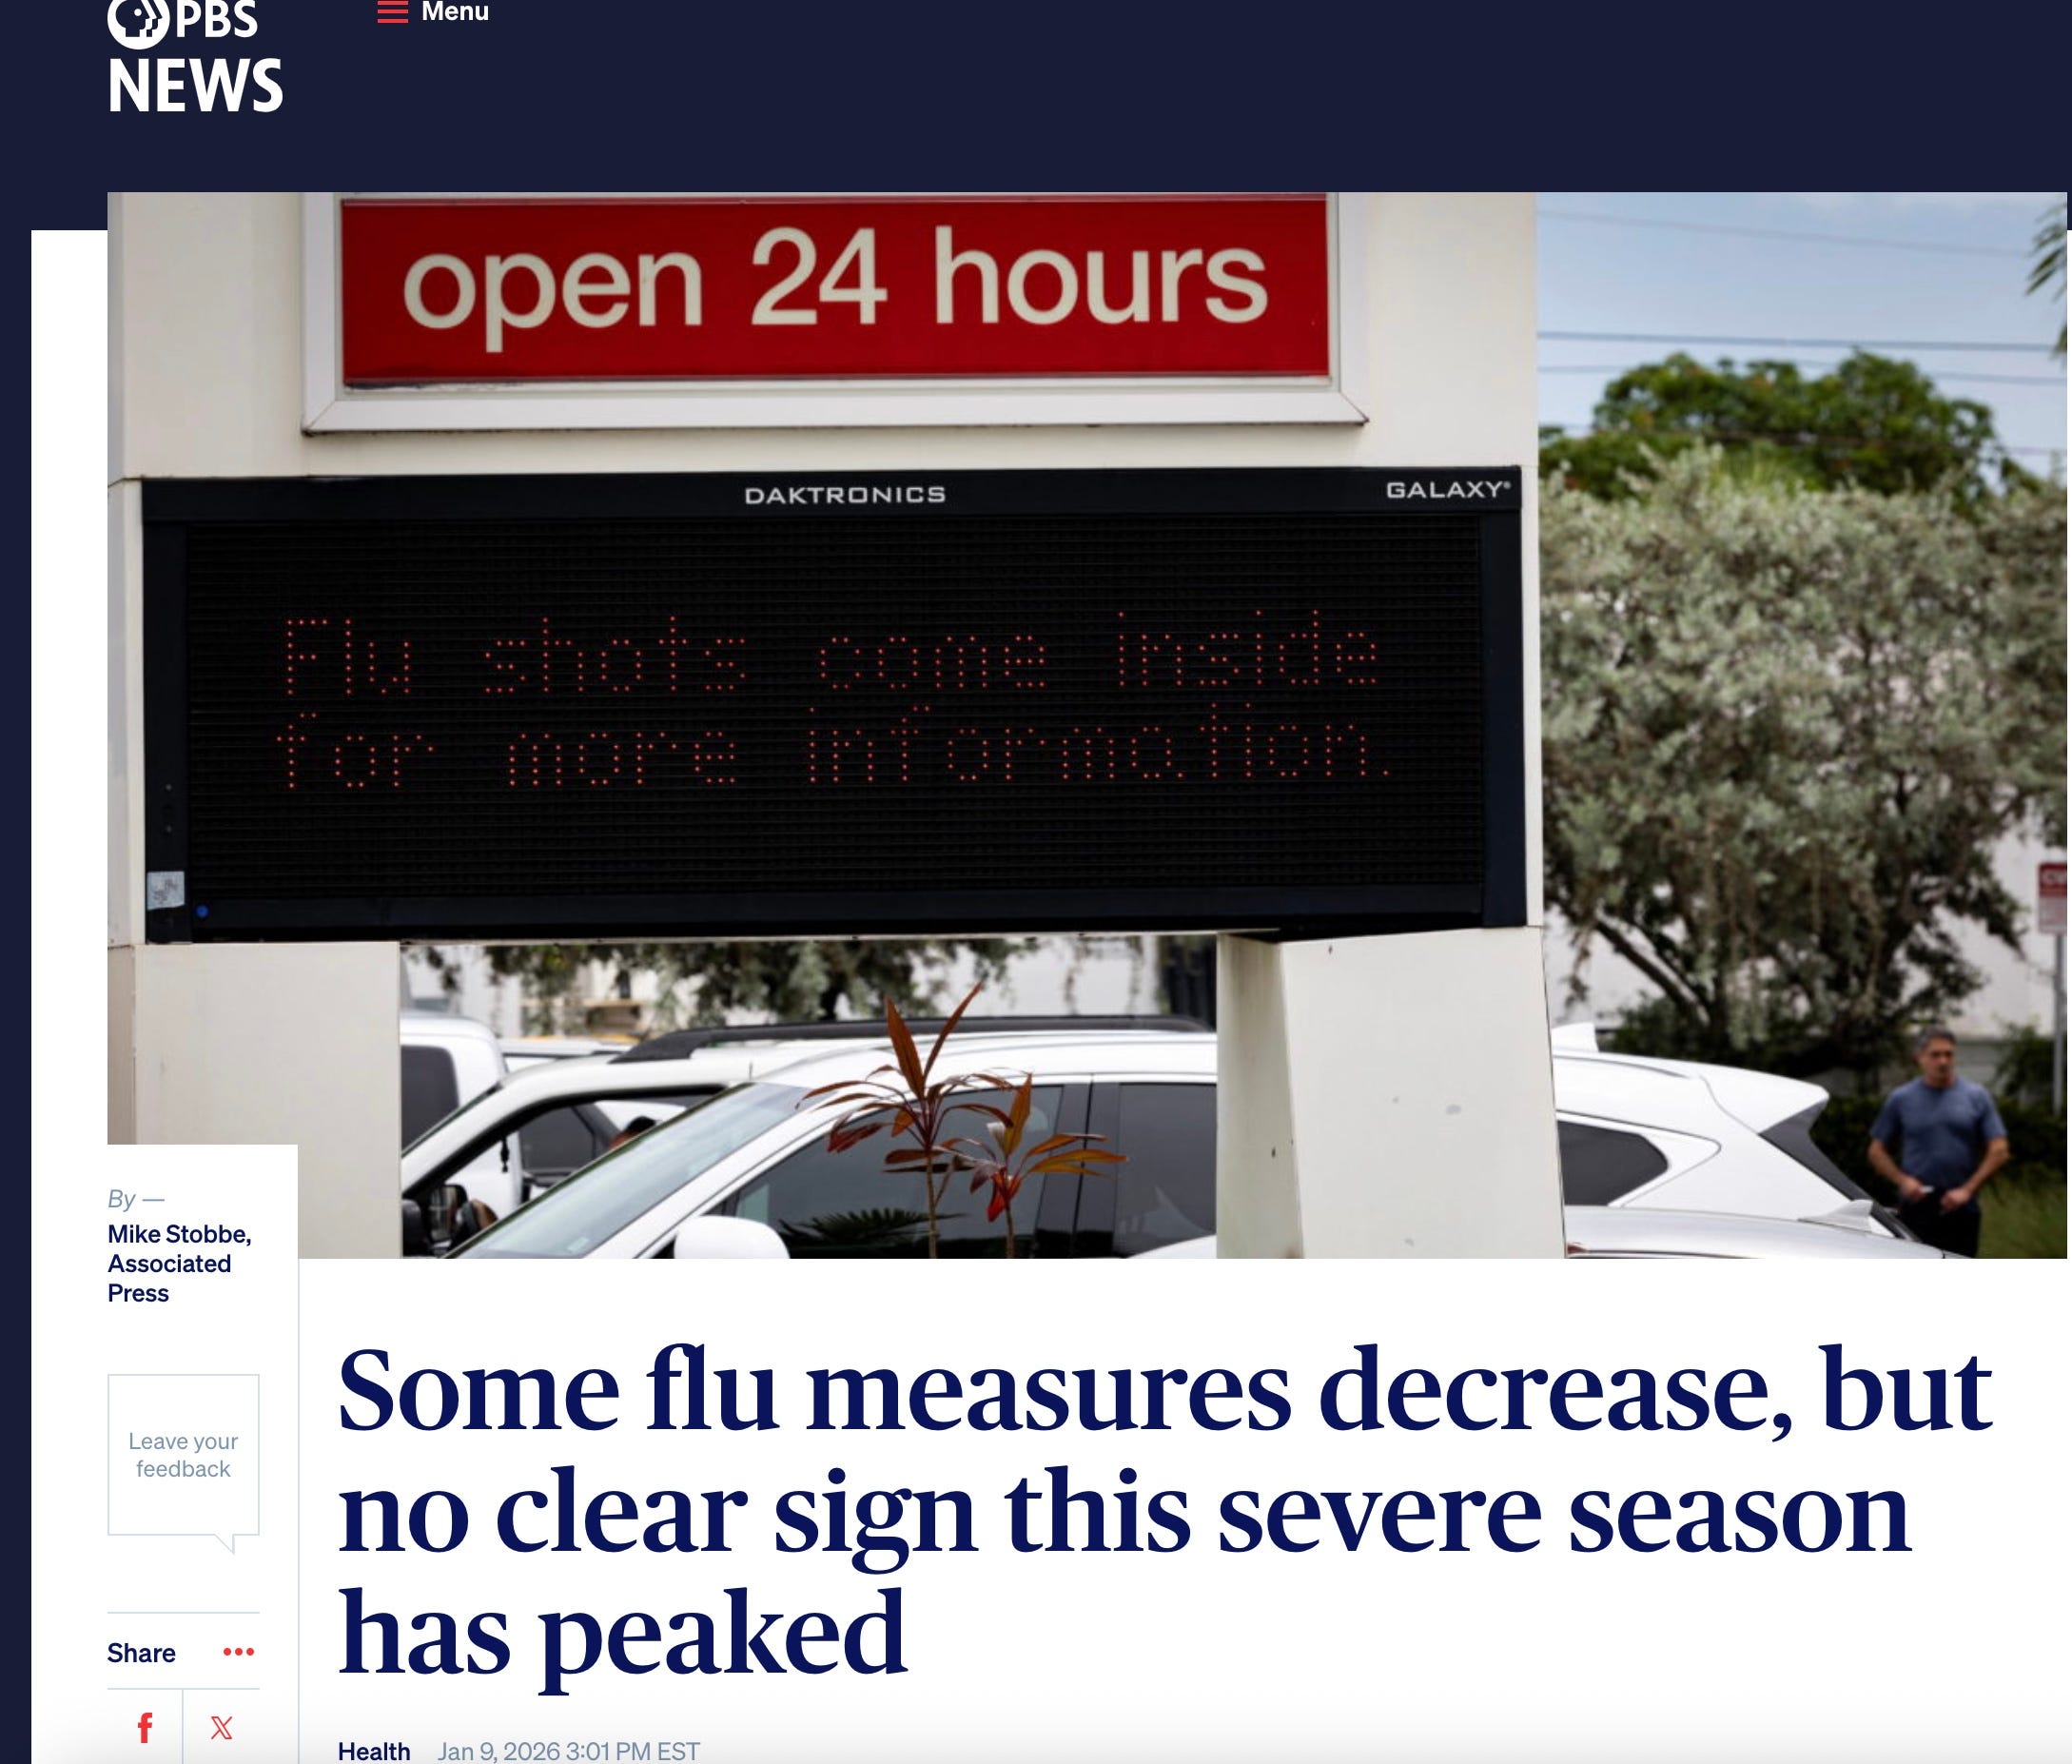
NEW YORK (AP) — U.S. flu infections showed signs of a slight decline last week, but health officials say it is not clear that this severe flu season has peaked.
New government data posted Friday — for flu activity through last week — showed declines in medical office visits due to flu-like illness and in the number of states reporting high flu activity.
However, some measures show this season is already surpassing the flu epidemic of last winter, one of the harshest in recent history. And experts believe there is more suffering ahead.
“This is going to be a long, hard flu season,” New York State Health Commissioner Dr. James McDonald said, in a statement Friday….
So far this season, there have been at least 15 million flu illnesses and 180,000 hospitalizations, the U.S. Centers for Disease Control and Prevention estimates. It also estimates there have been 7,400 deaths, including the deaths of at least 17 children.
Last week, 44 states reported high flu activity, down slightly from the week before. However, flu deaths and hospitalizations rose.
As you can see from the graph above, flu hospitalizations decreased last week compared to the week before. So does Mike Stobbe of AP means that cumulative deaths and hospitalizations this season rose? Of course they rose—they can’t drop!

Both AP and PBS seek your donations. I support trusted journalism—but you can’t find it in the sources I’ve cited here.